What did the marginal reef say?

Mikul Rai · November 2025


Coral reefs are among the planet’s most vital and diverse ecosystems, yet they are increasingly under threat from human activity and climate change. Passive Acoustic Monitoring offers a scalable, non-invasive way to assess reef health by listening in on their underwater soundscapes. Healthy reefs burst with the crackle of snapping shrimp, melodic fish calls, and a vibrant chorus of marine life, whereas degraded reefs fall silent and eerily quiet. This study explores whether the SurfPerch foundation model, originally trained on tropical reef audio, can accurately distinguish between healthy and degraded coral reefs in the sub-tropical, turbid waters of Moreton Bay, Australia.

0.94
ROC AUC
90.6%
Accuracy
+25%
vs MFCC Baseline

What does reef health sound like?

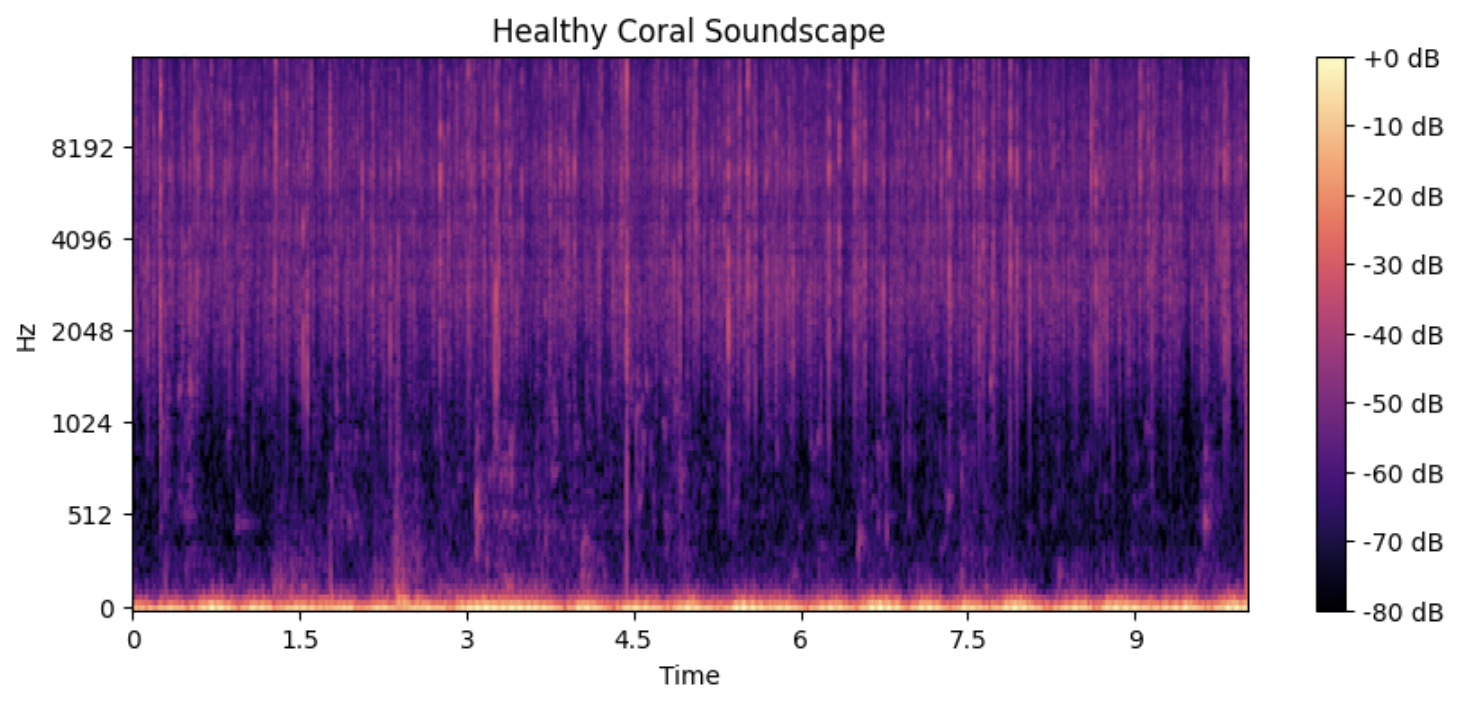
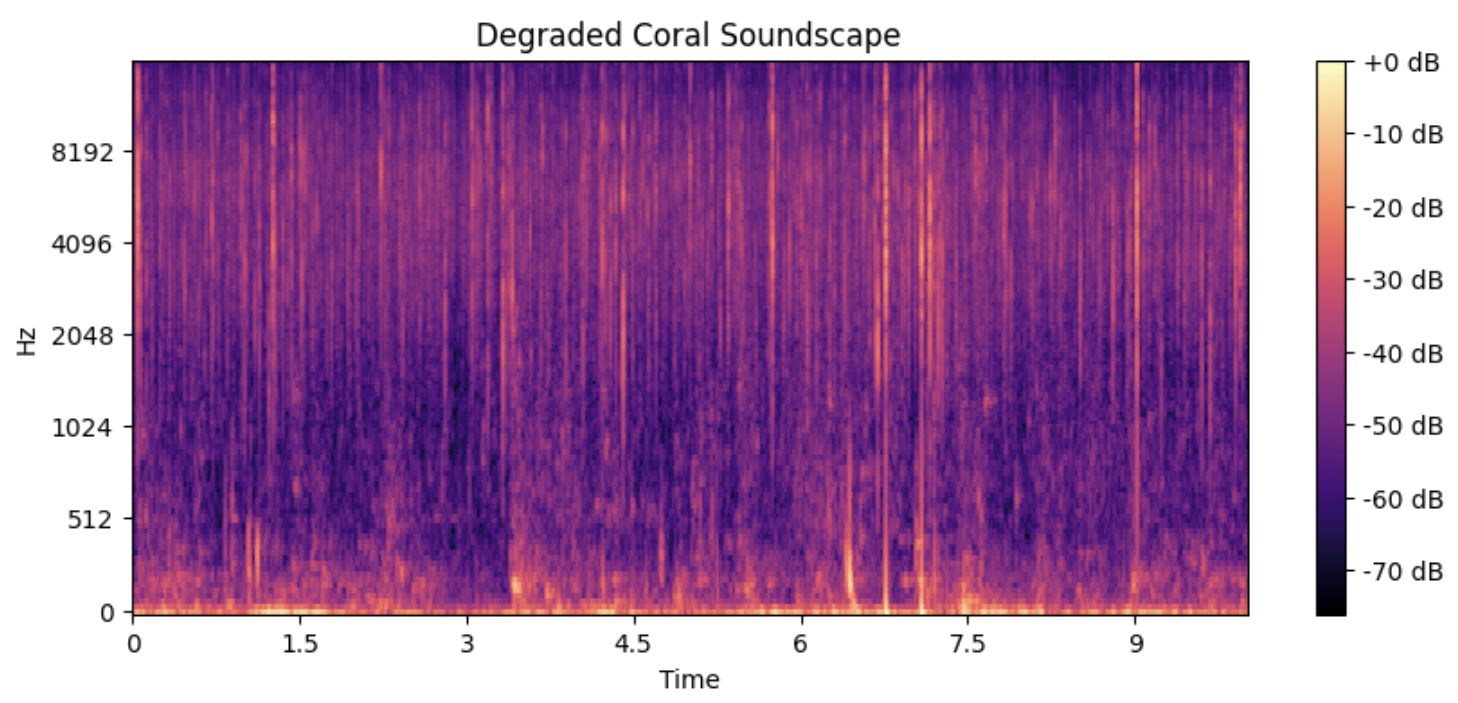
Healthy coral reefs produce a dense, continuous acoustic signature dominated by snapping shrimp clicks and fish vocalizations in the 512–2048 Hz range. Degraded reefs, stripped of their biological communities, are sparse and transient-heavy. The difference is striking even as a spectrogram.

Healthy, Myora Reef

Mel spectrogram of healthy Myora Reef
spectrogram-healthy.png

Degraded, Goat Island

Mel spectrogram of degraded Goat Island
spectrogram-degraded.png

Mel spectrograms of 5-second clips from each site. Myora shows sustained broadband biophony; Goat Island is acoustically impoverished.

Two reefs, same bay, different stories

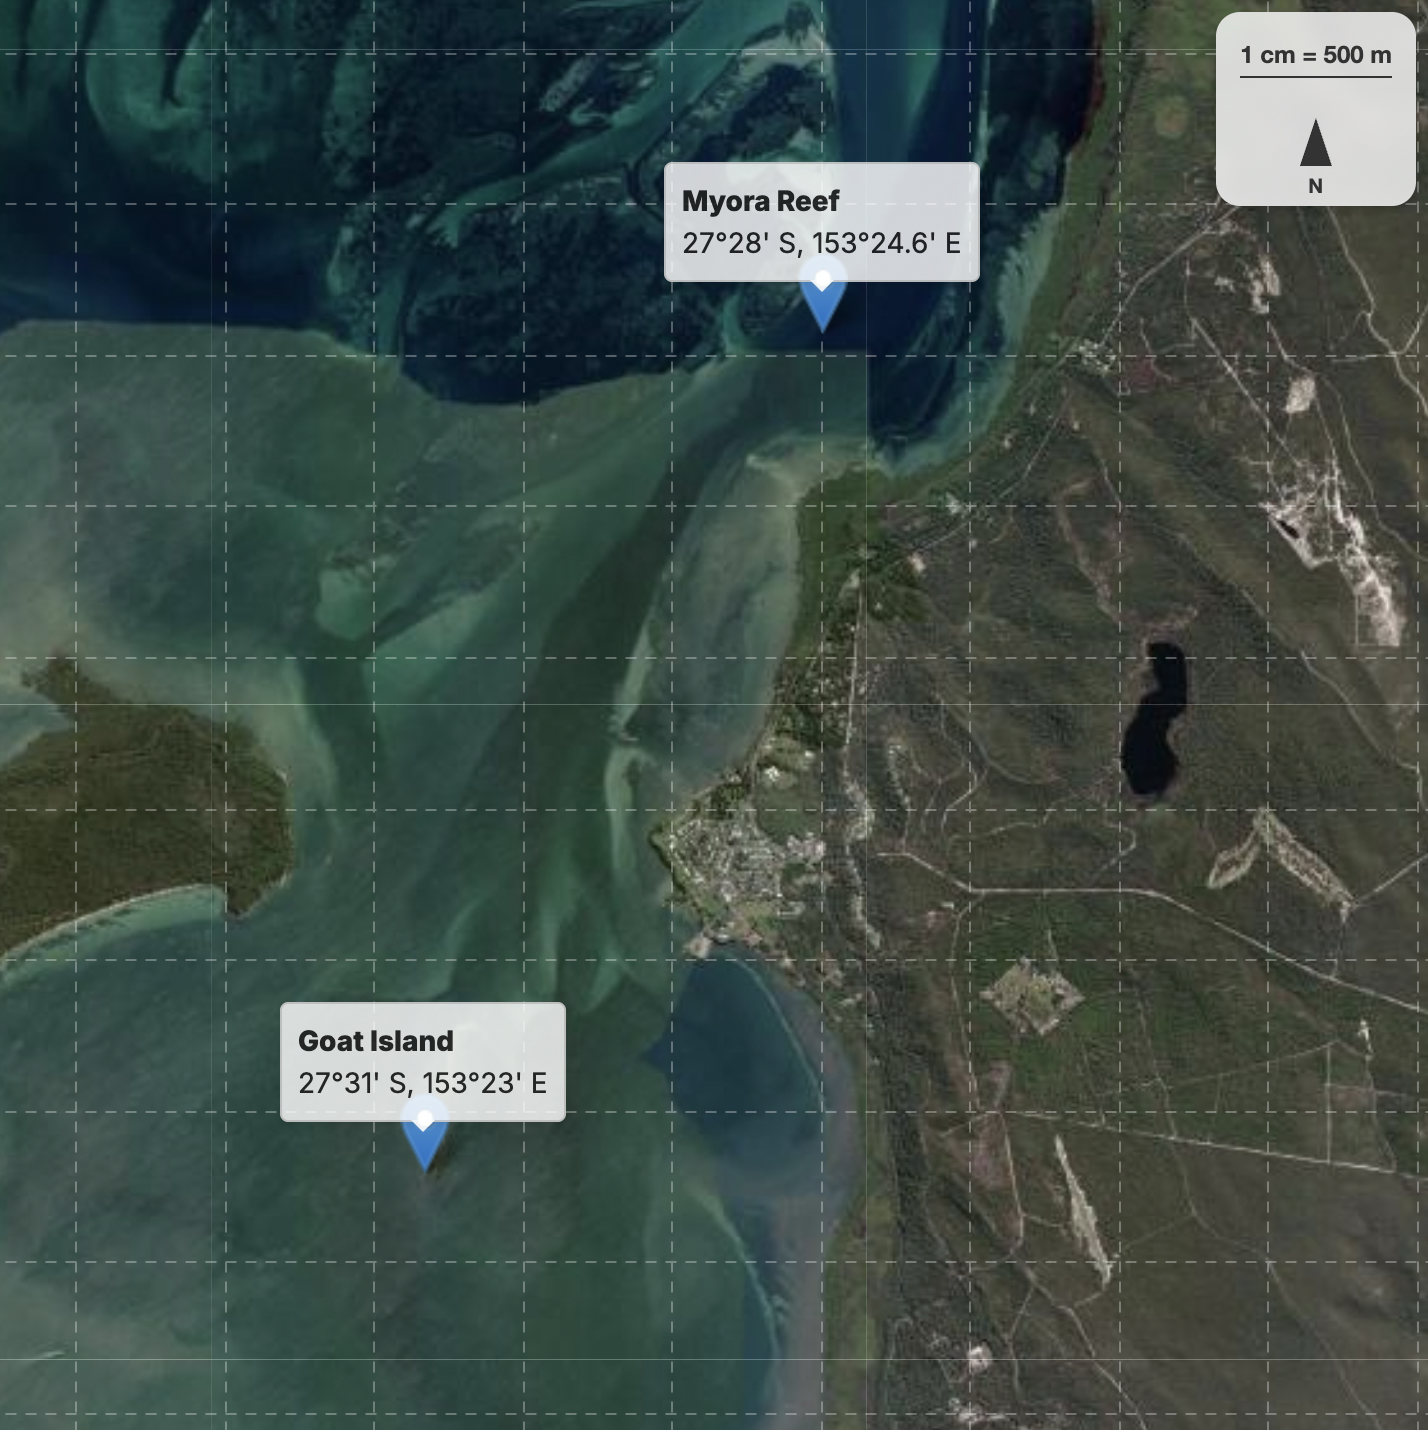
Both sites are sub-tropical reefs in Moreton Bay, Queensland: high-latitude, turbid, and ecologically marginal. Myora Reef is flushed by oceanic water via Rainbow Channel and supports 23–42% Acropora coral cover. Goat Island, just a few kilometers away, is sediment-impacted from riverine runoff and still recovering from a 2022 flood event.

Myora Reef

Healthy reference

Location
27°28'S, 153°24.6'E
Coral cover
23–42% (Acropora)
Depth
1.90 ± 0.57 m
Turbidity
0.39 NTU
Audio
50.8 min (11 files)

Goat Island

Degraded, sediment-impacted

Location
27°31'S, 153°23'E
Coral cover
Minimal (mud drape)
Depth
2.03 ± 0.59 m
Turbidity
0.60 NTU
Audio
30.0 min (8 files)
Satellite map of Moreton Bay showing Myora Reef and Goat Island study sites
map.png

Moreton Bay, Queensland. Recorded by us, over four days in November 2025 using a Cetacean Research CRT-40P hydrophone at 48 kHz / 24-bit.

Pipeline

Raw Audio

80 min of underwater recordings

Preprocessing

Artifact removal, 32kHz mono

5s Segments

7,973 labeled windows

SurfPerch

1,280-dim embeddings (frozen)

Classifier

Linear + neural network sweep

Health Label

Healthy or Degraded

What SurfPerch sees

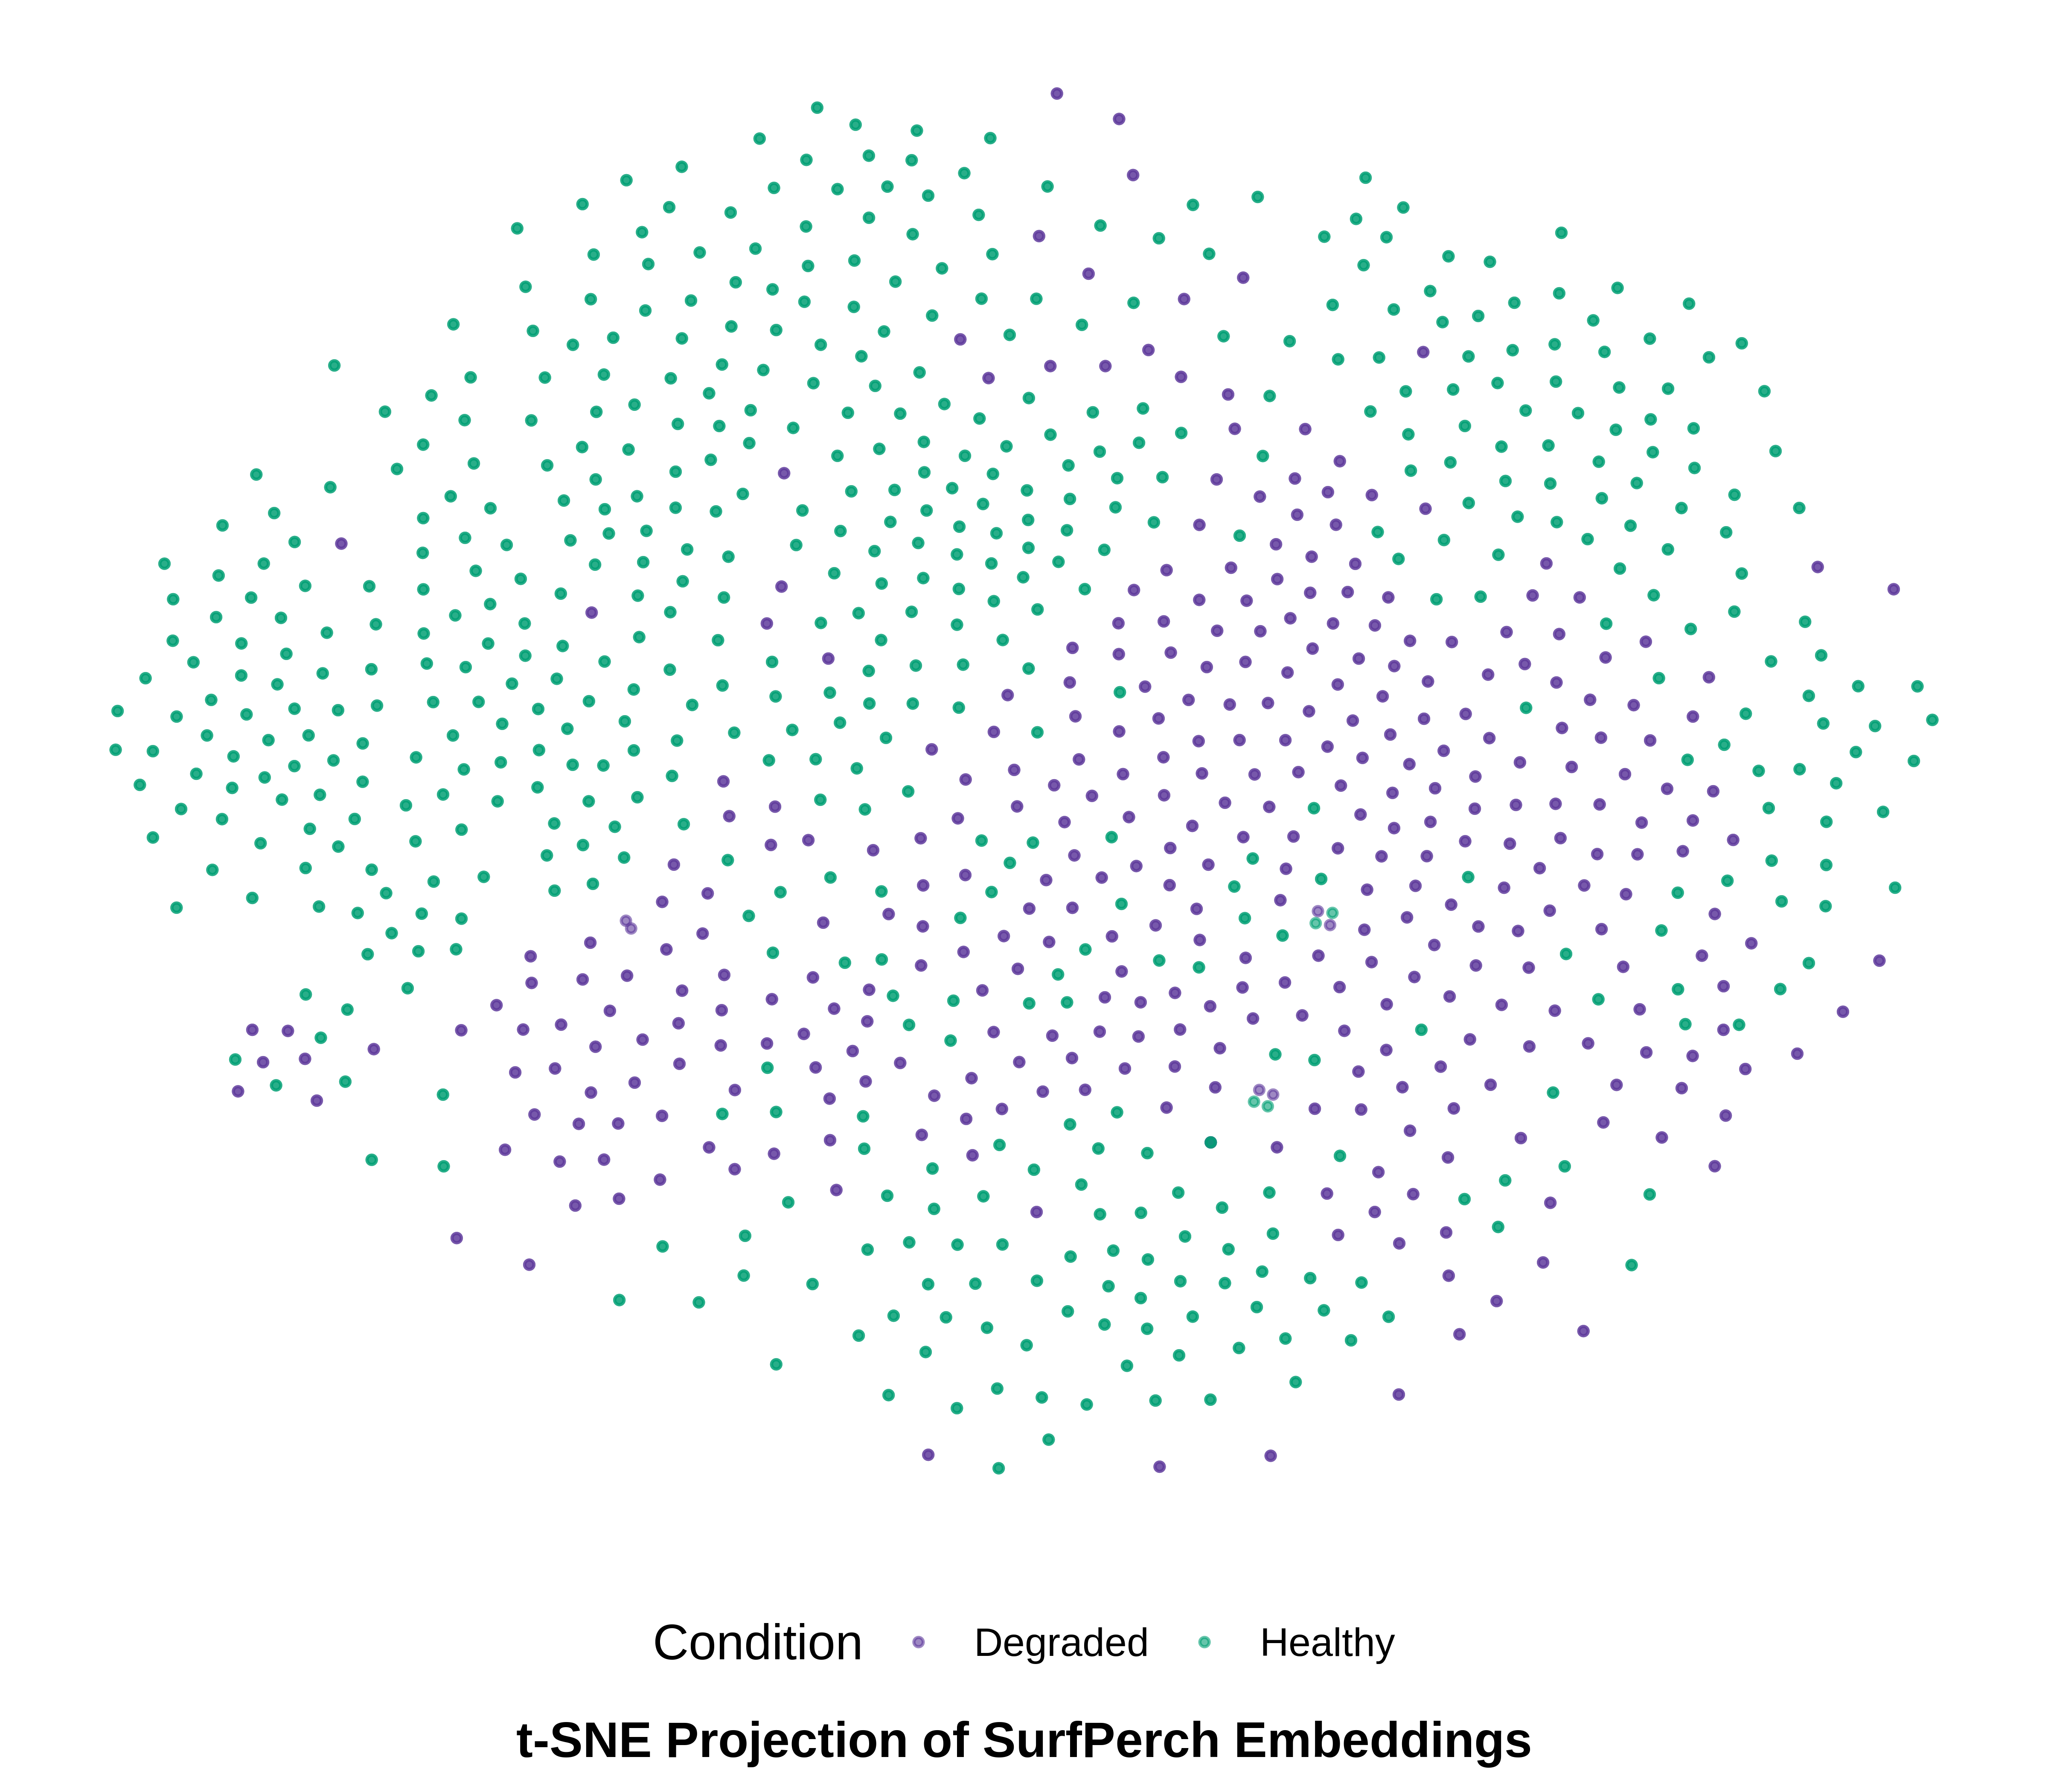
Projecting the 1,280-dimensional embeddings into 2D with t-SNE reveals clear structure. Healthy Myora samples form a dense, coherent cluster, while degraded Goat Island samples are more dispersed. The partial overlap suggests some acoustic similarity at the margins, but the bulk of the data separates cleanly.

t-SNE projection of 7,973 audio segments
tsne.png

t-SNE projection of 7,973 five-second audio segments. Green: Healthy (Myora Reef). Purple: Degraded (Goat Island).

SurfPerch vs. hand-crafted features

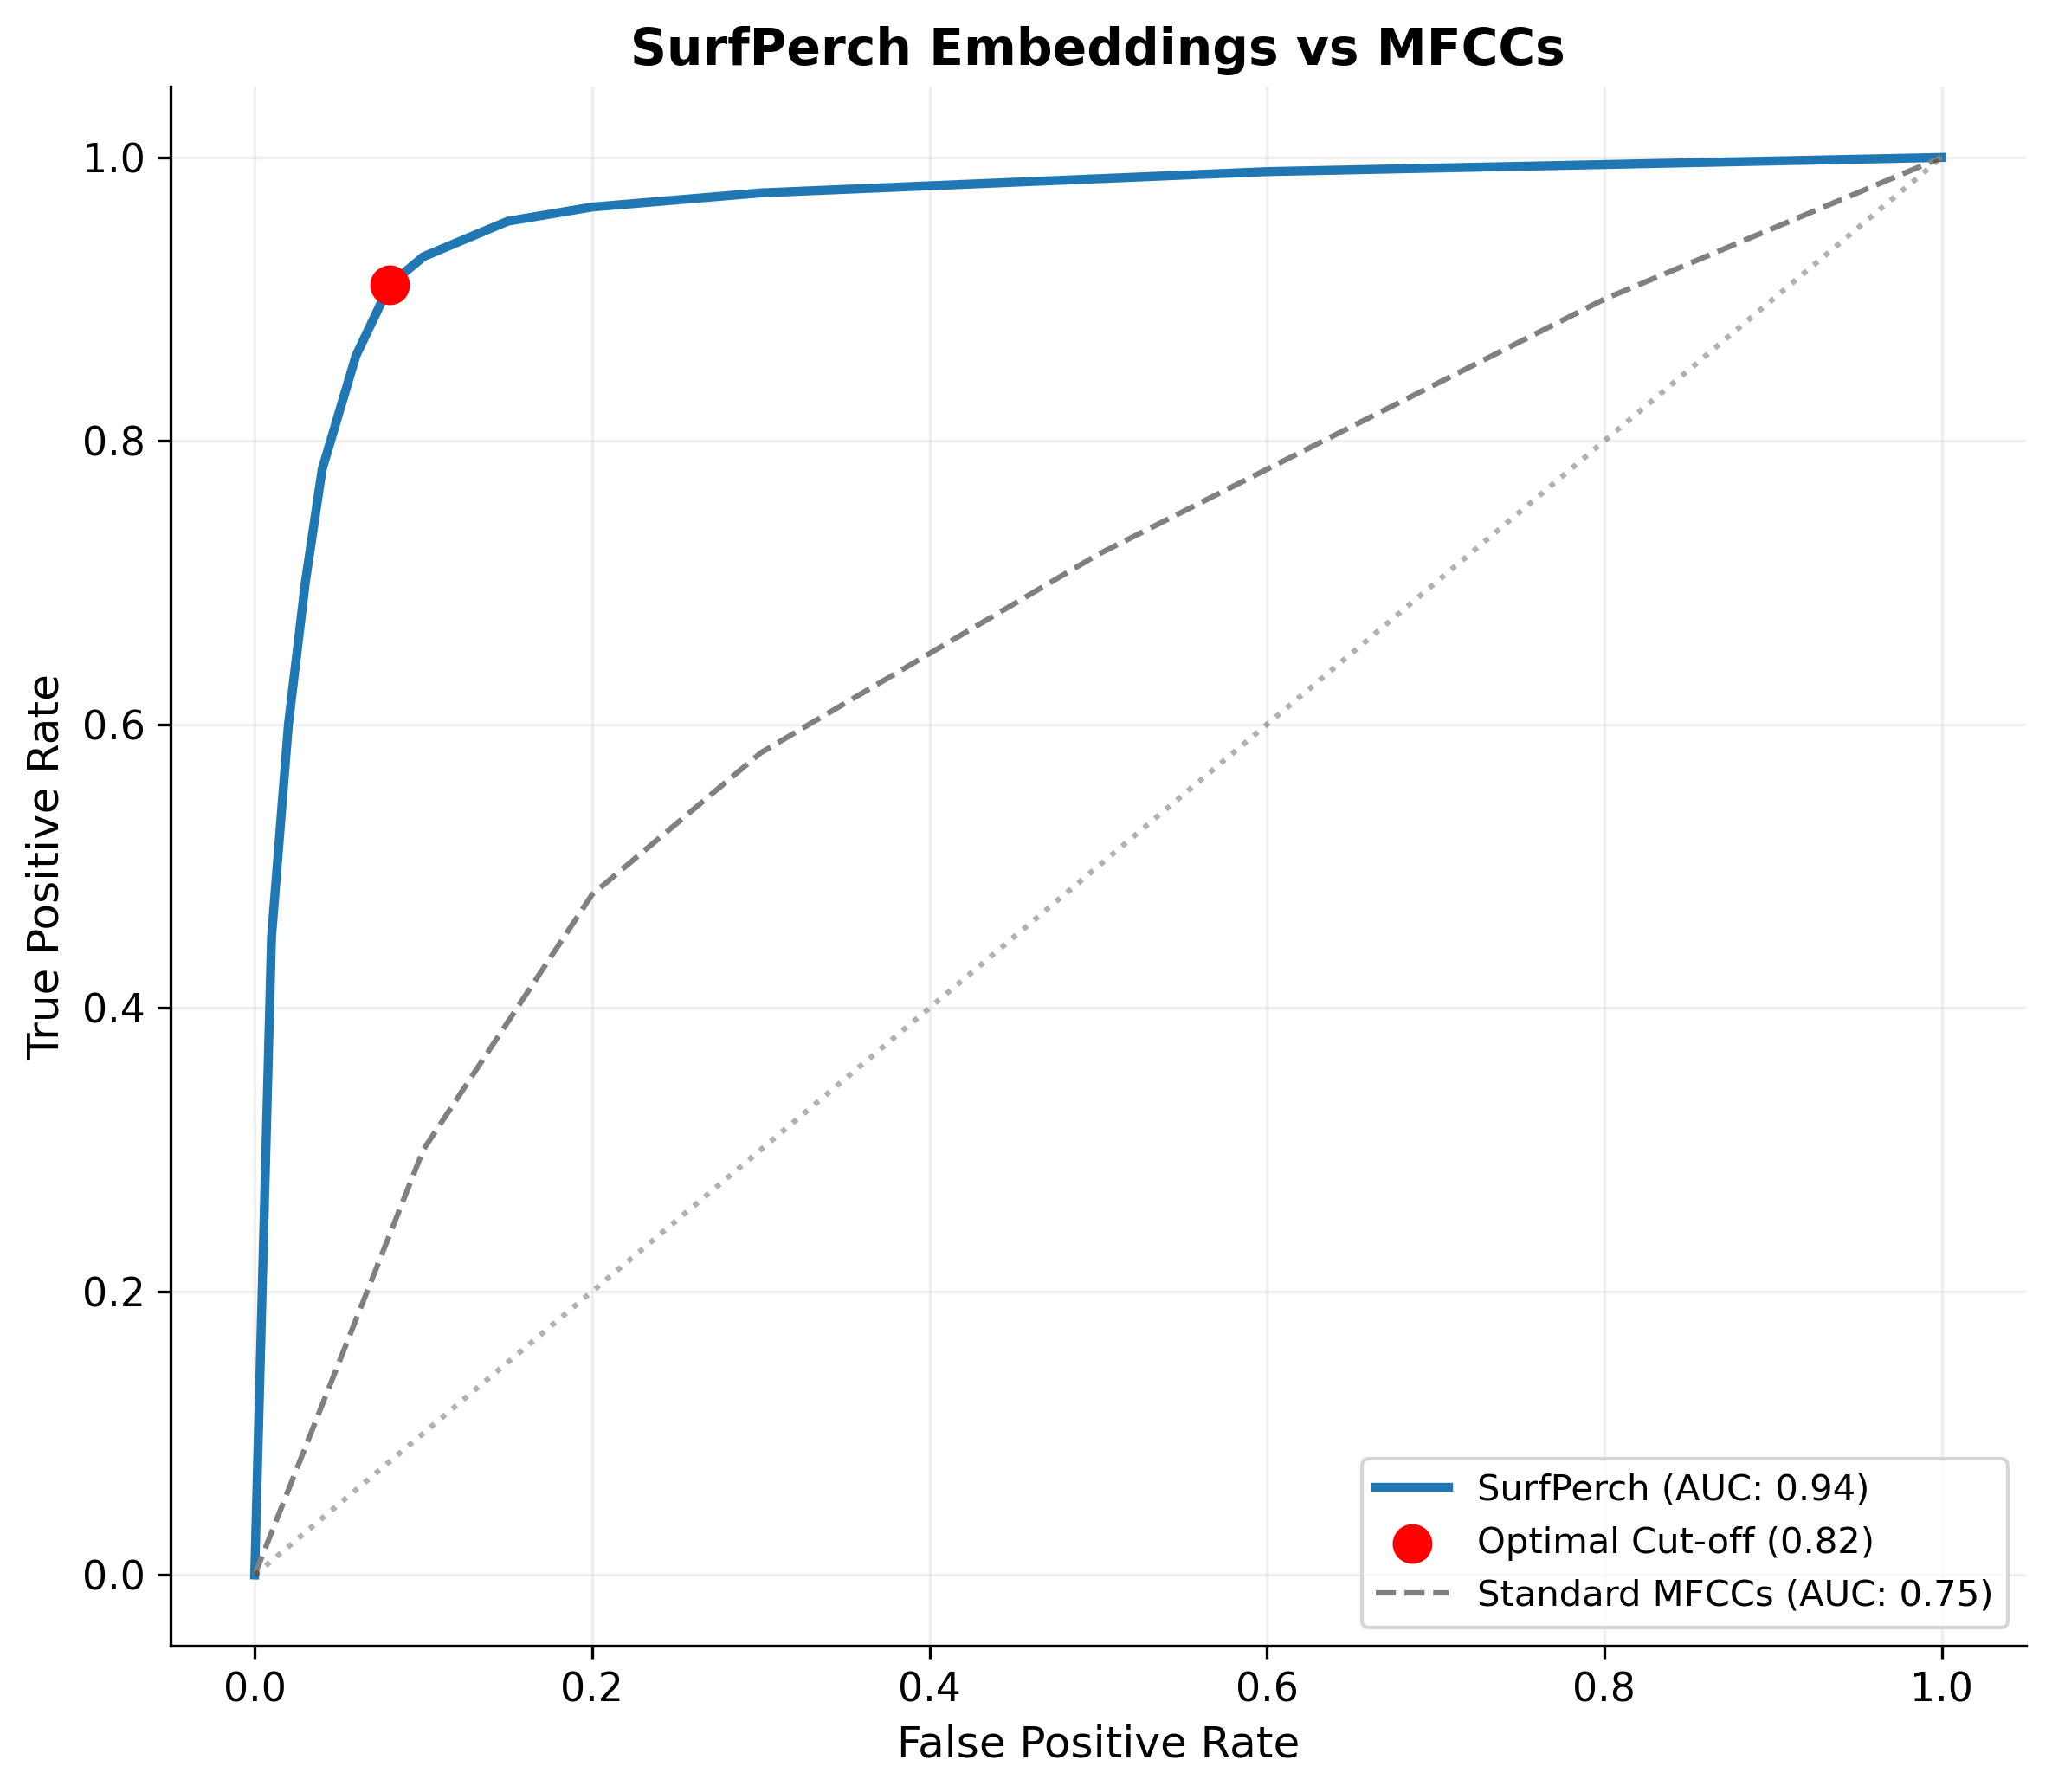
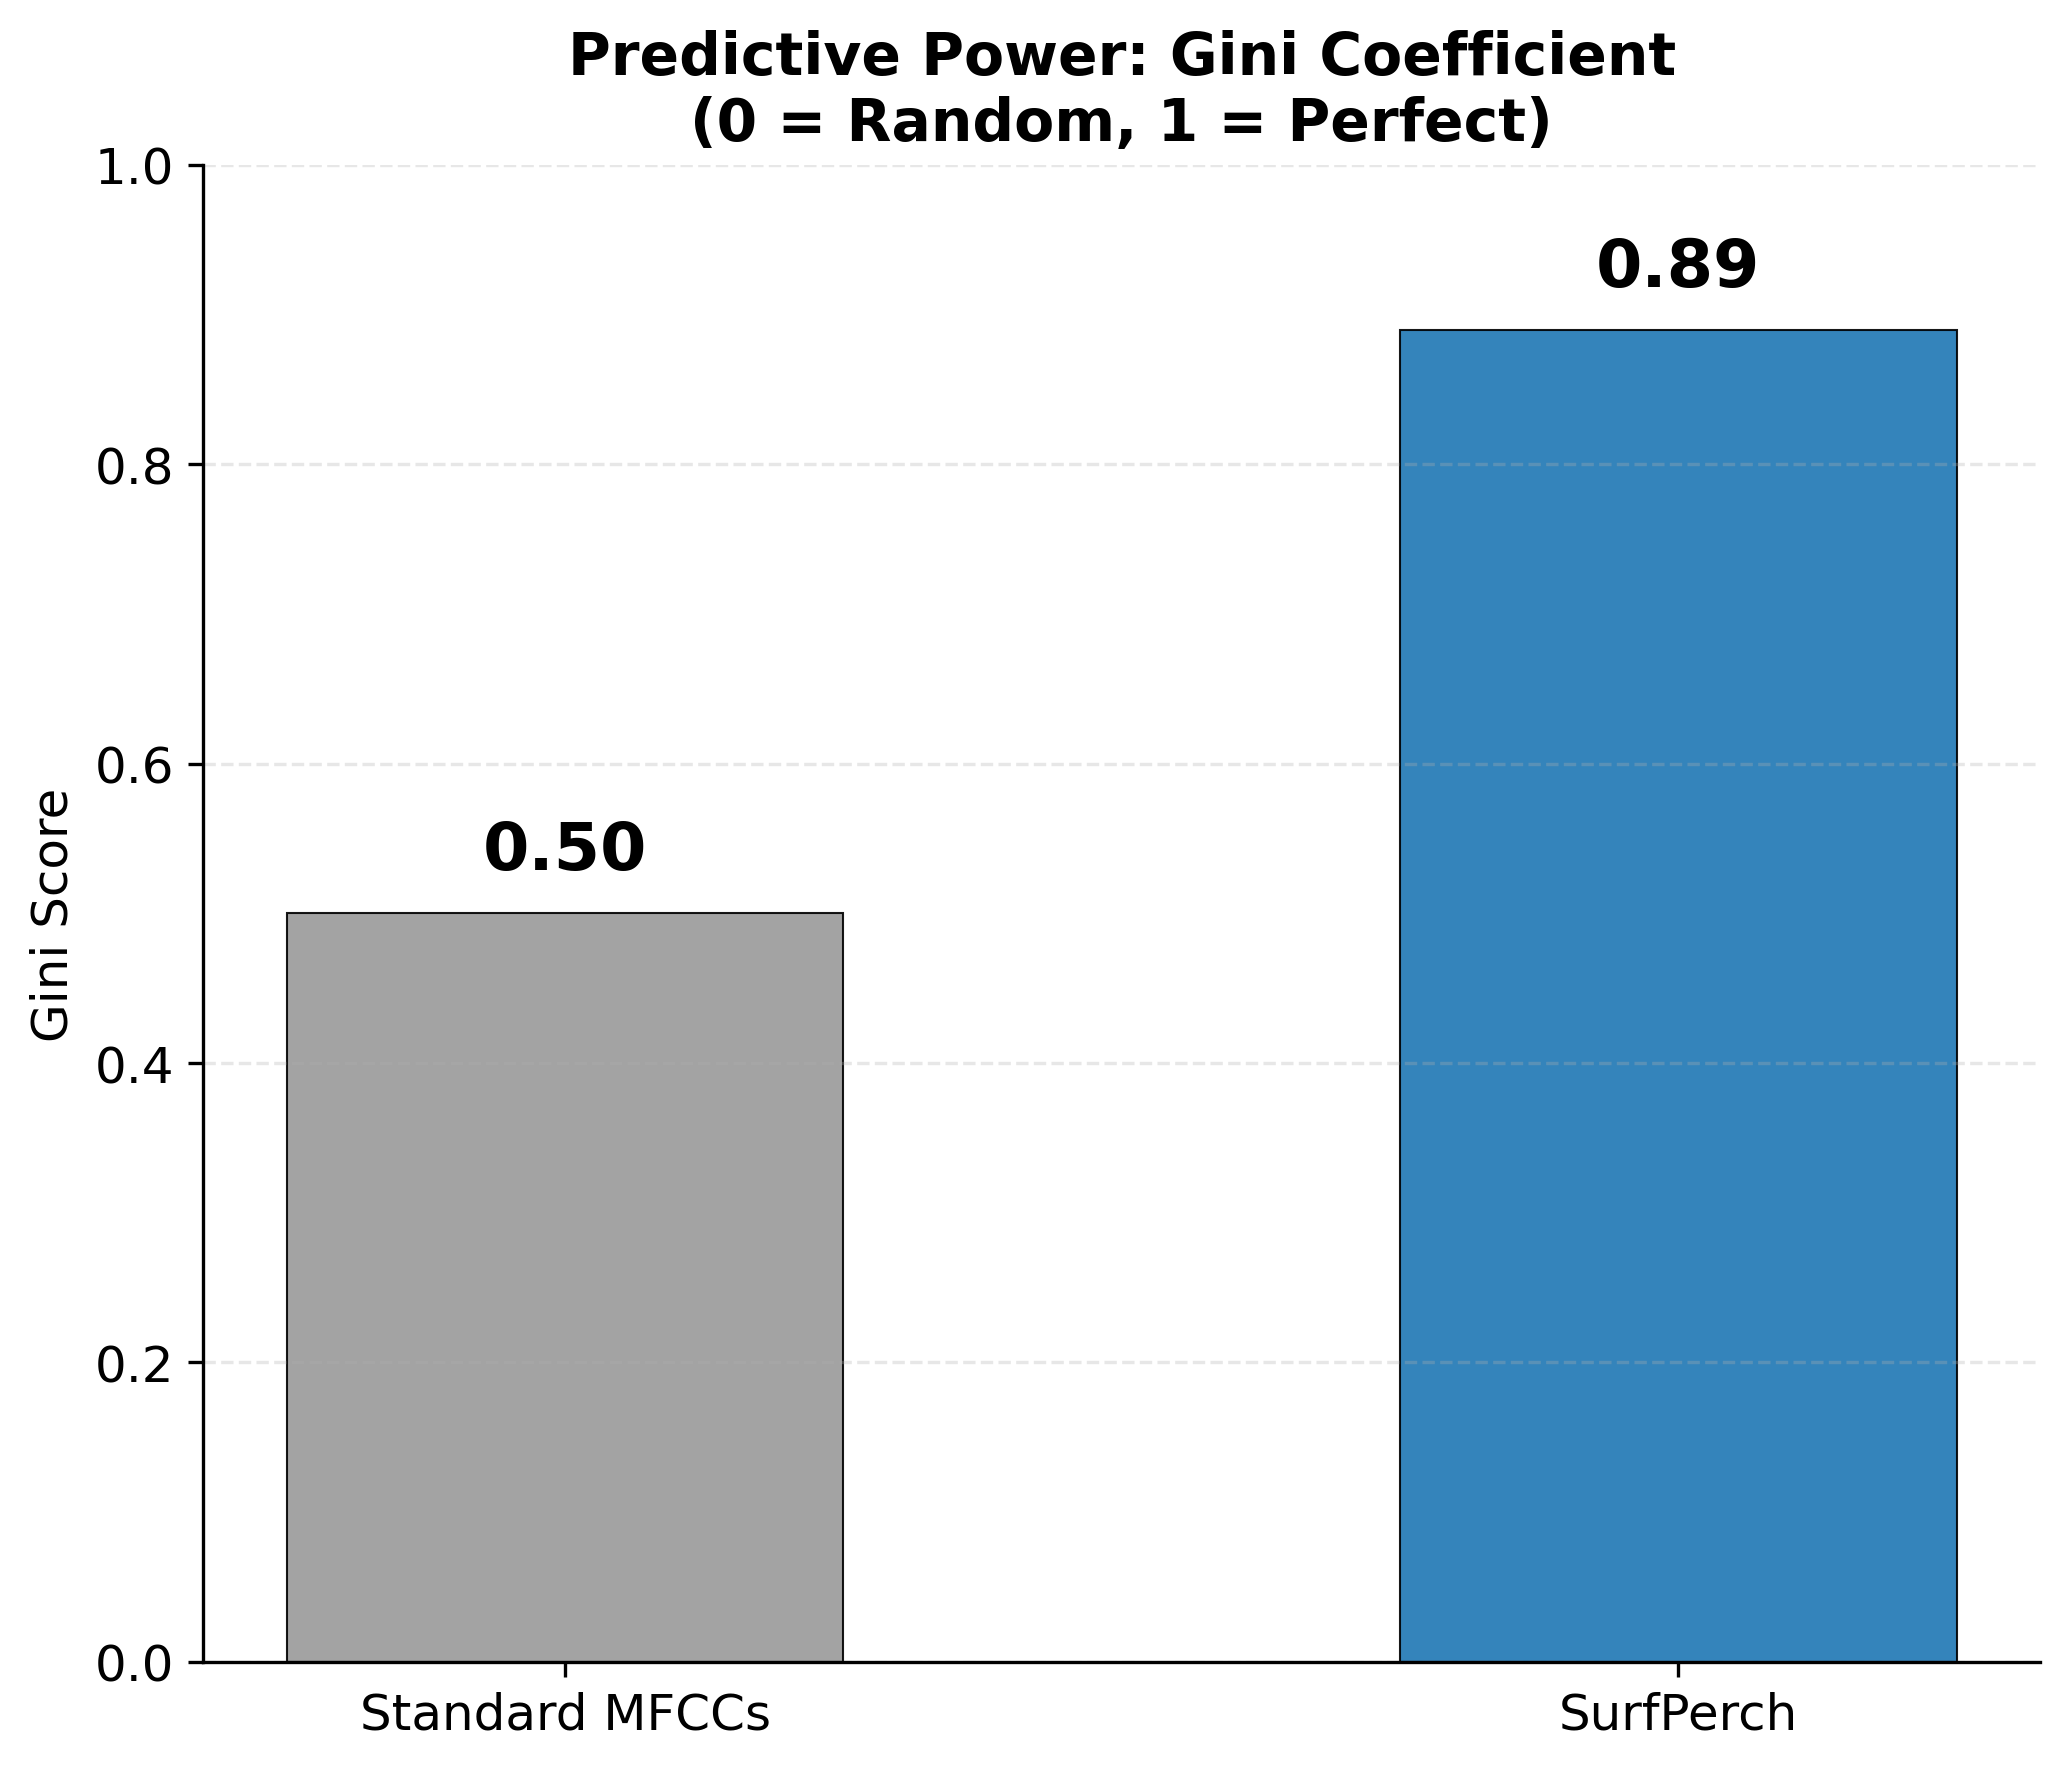
SurfPerch embeddings dramatically outperform traditional MFCCs across every metric. The model achieves 0.94 AUC with a simple linear head on frozen embeddings, no fine-tuning required. The Gini coefficient nearly doubles (0.89 vs 0.50), indicating far stronger discriminative power.

ROC curve comparing SurfPerch vs MFCC baseline
roc.png

ROC curves. SurfPerch (AUC = 0.94) vs MFCC baseline (AUC = 0.75). Optimal threshold at 0.82.

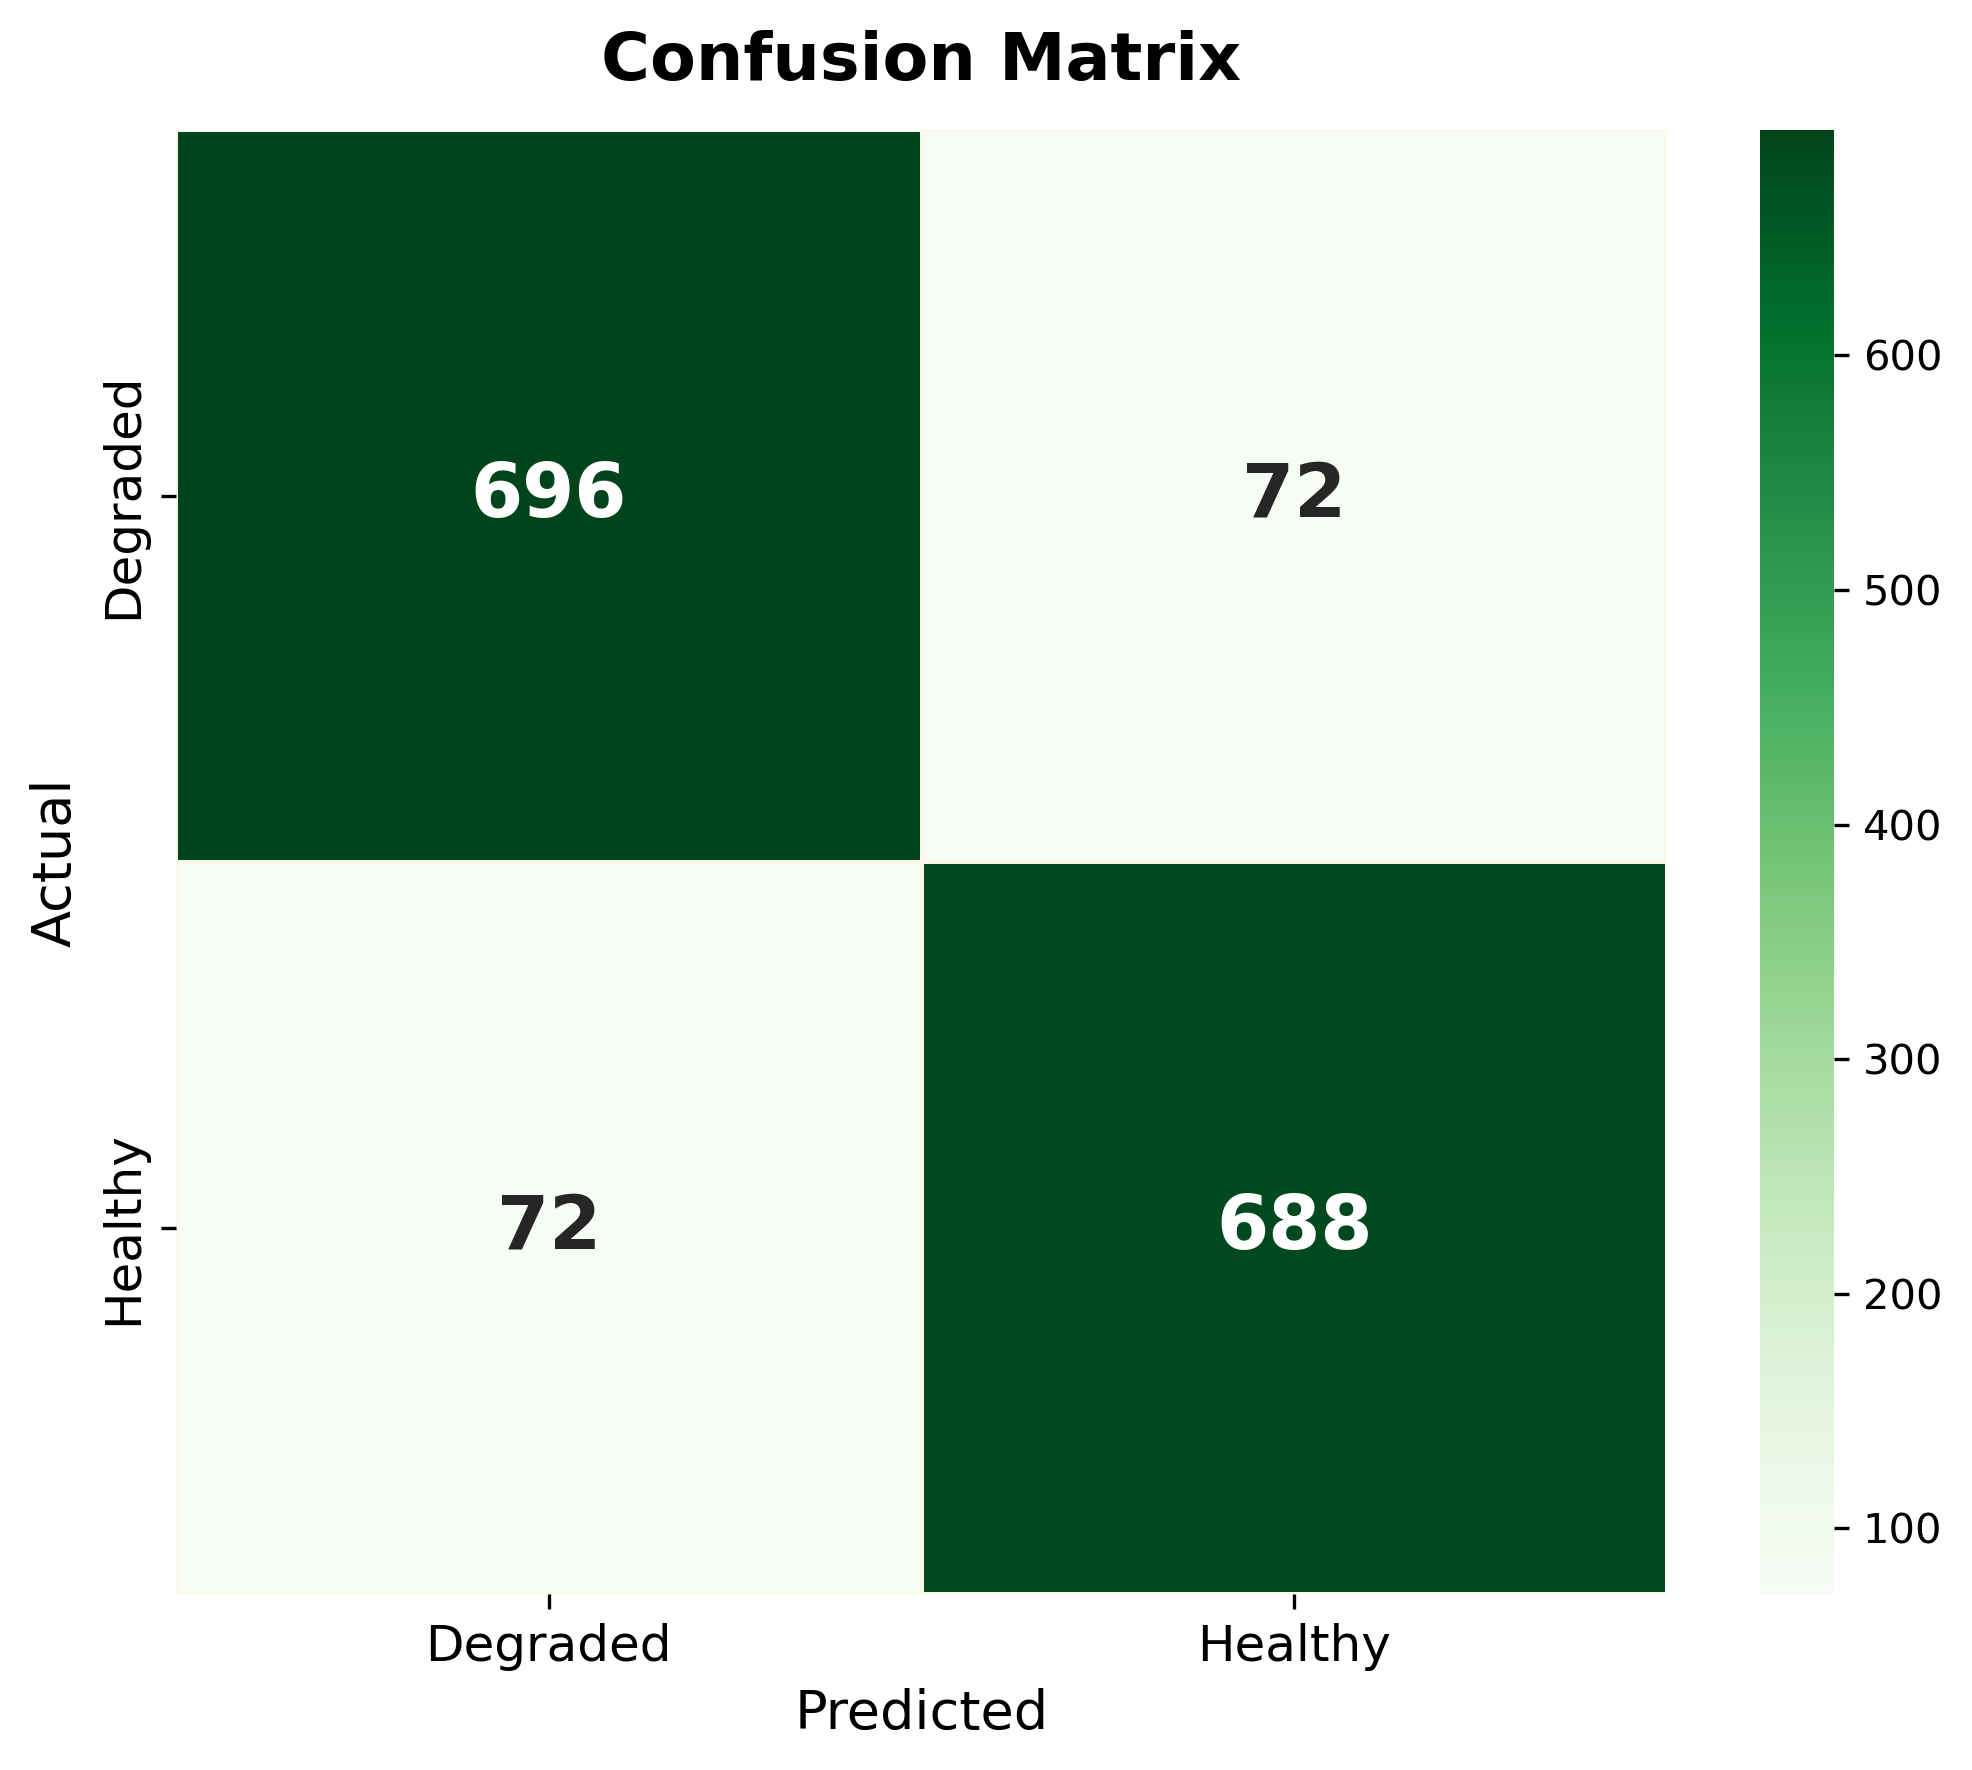
Confusion matrix
confusion-matrix.png

Confusion matrix at threshold 0.82. Balanced recall: 89.6% degraded, 91.6% healthy.

Gini coefficient comparison
gini.png

Gini coefficient. SurfPerch: 0.89. MFCC: 0.50.